INTRODUCTION
Hey, welcome to our website!
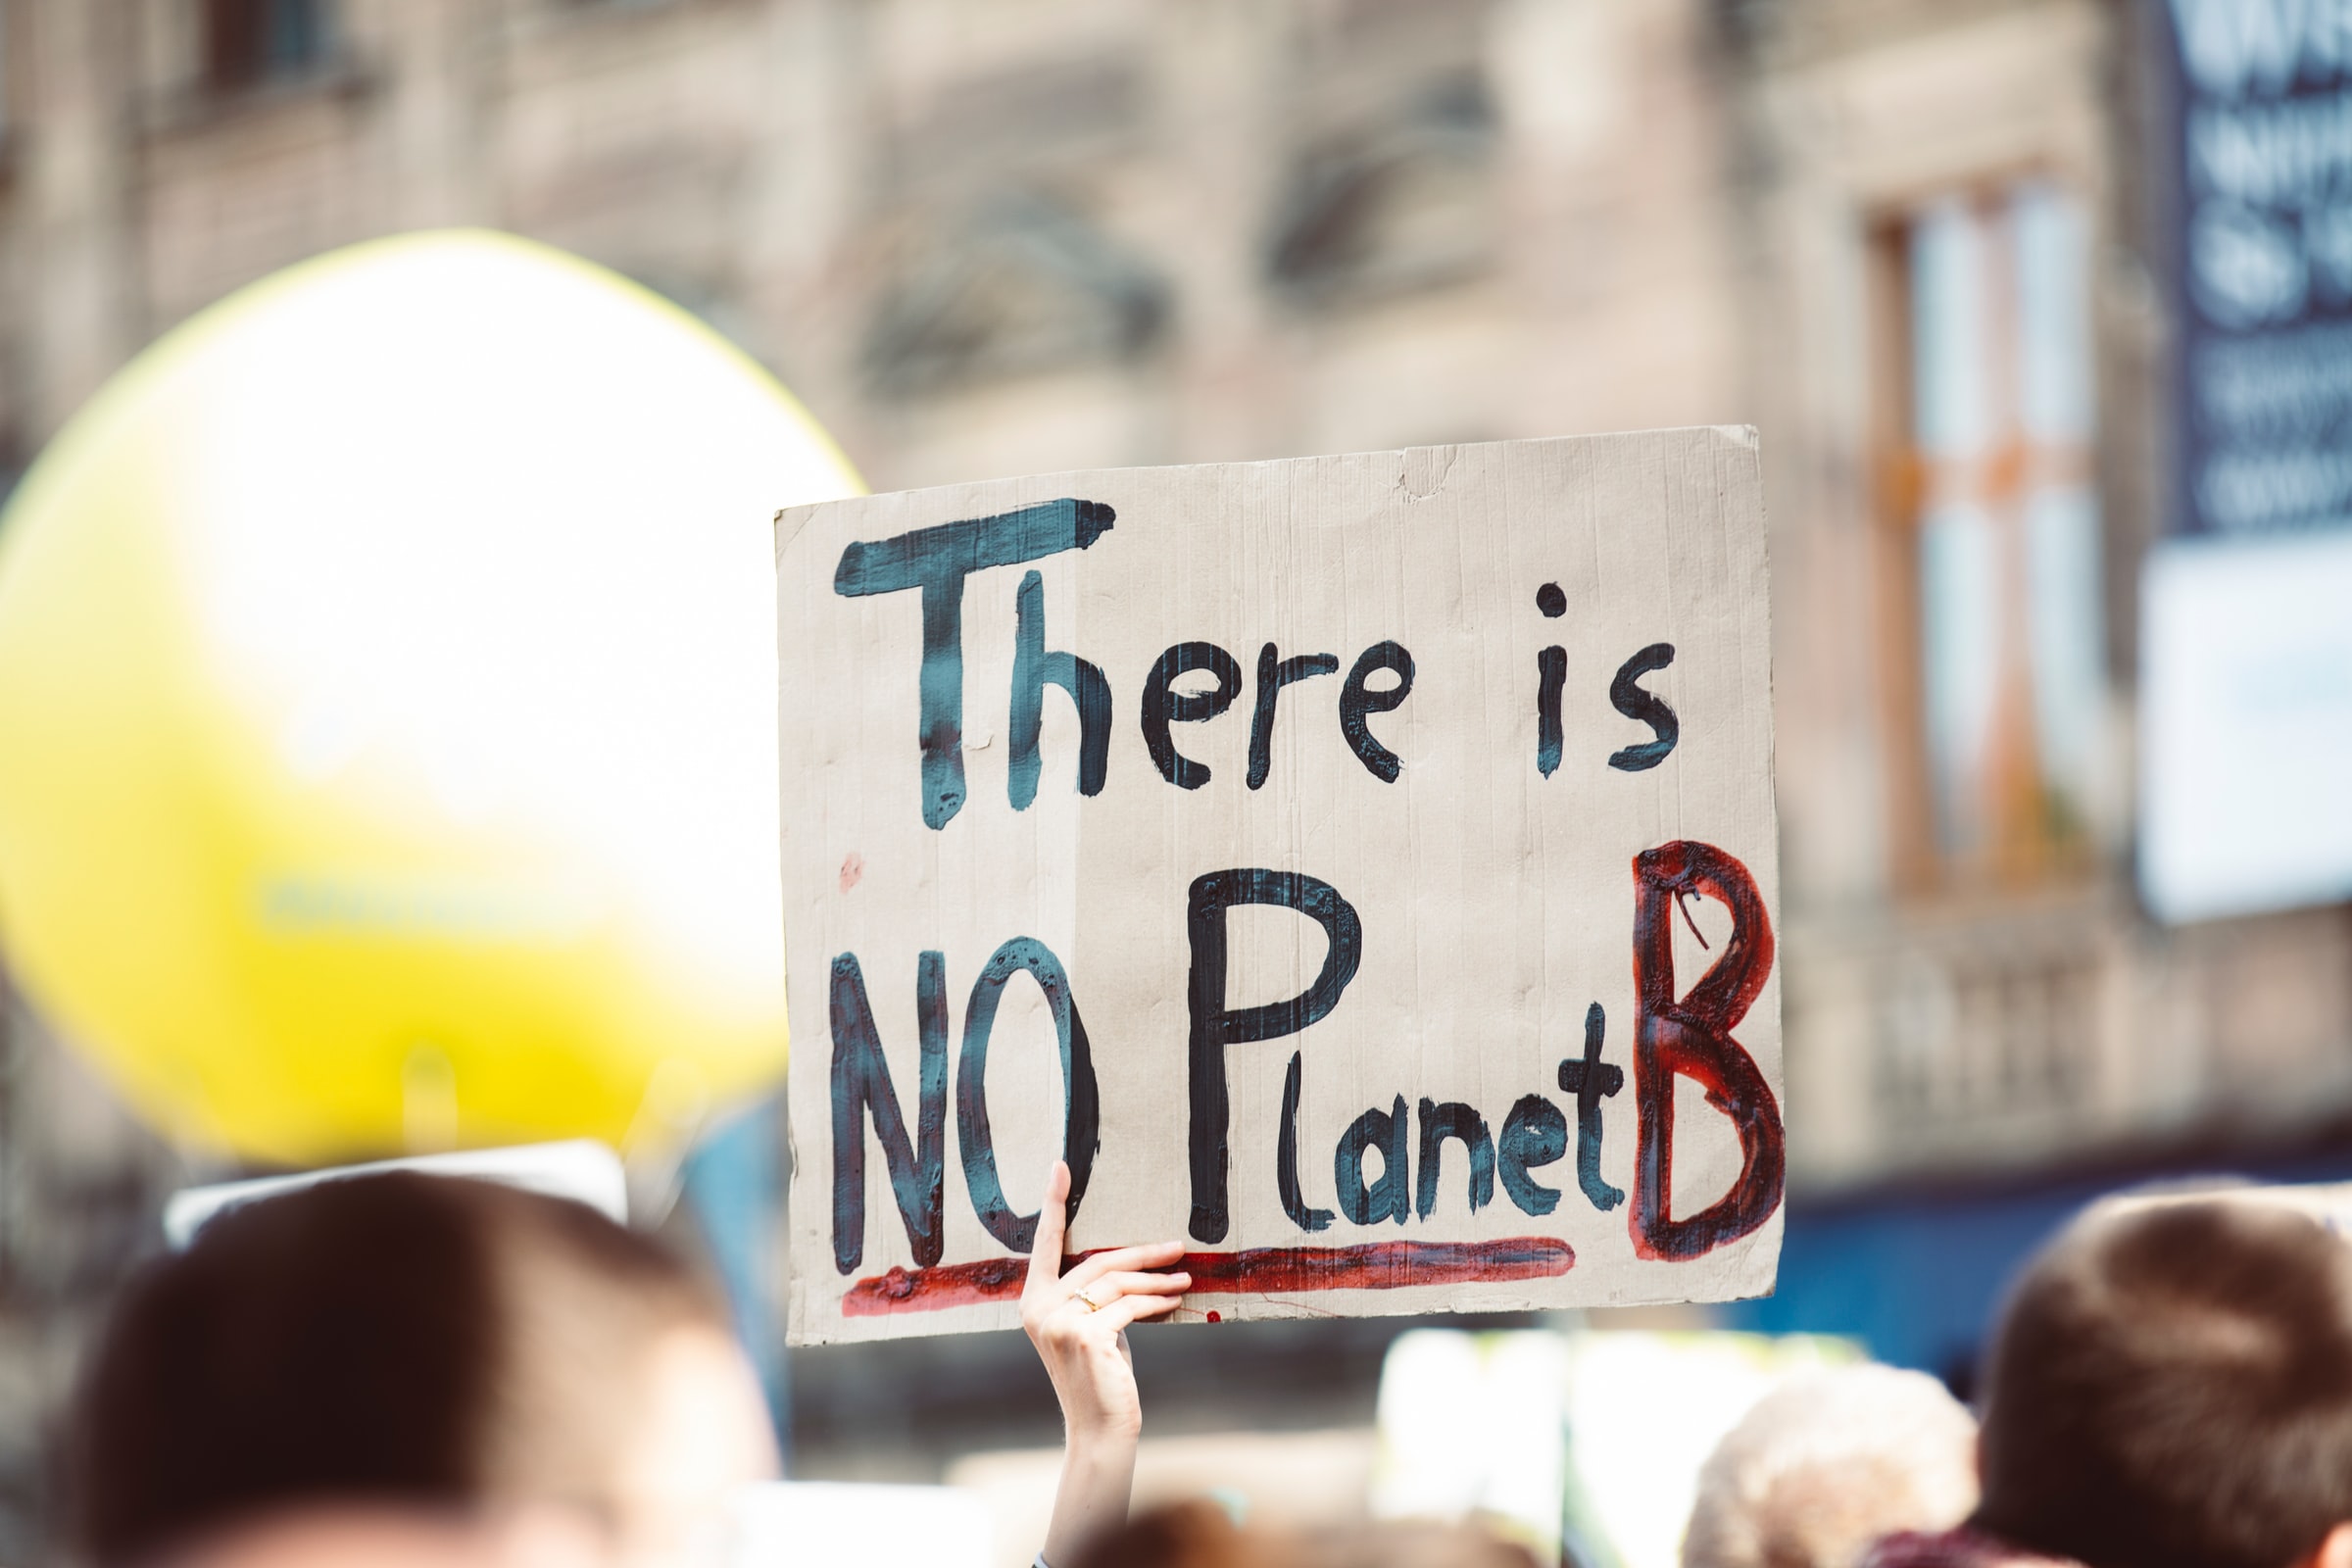
We are three EPFL students and we wanted to dedicate our data visualization knowledge to a topic we care about, and we really think you should too: Climate Change. The recent increase in temperature globally is very likely due to our CO2 emissions that have been exploding in the past few decades [1]. This phenomenon is known as the greenhouse effect [2].
We are not specialists in the subject, and while diving deeper, we realised that we were lacking simple resources that introduce the topic in its globality. We wanted everyone to have a basic understanding of greenhouse gases emissions, and where they are coming from. We will start with a Global overview of emissions, and then dive into each sector: Energy, Industry, Agriculture, and Transportation.
In the following part, you will have an overview of CO2 emissions worldwide, from 1990 to 2017 [4]. We used the CO2e metric [3], thus allowing us to gather all greenhouse gases emissions in the same value. Please feel free to explore by choosing different years (slider), countries (click).
Observe the total emissions changing, the split between each sector evolving… Ps: Have a look at Norway in 2017 or countries in green to see the effects of reforestation.
- :

Industry
It is not widely known, but producing materials, objects and chemicals is one of the biggest sources of emissions, 23% of the total. Unfortunately, It is also one of the sectors that need the most innovation to reduce its emissions.
For example, the process (calcination reaction) needed to create cement directly emits CO2 [9]. Moreover, we will not stop building cities (cement, iron, steel) any time soon, as the total population will increase until 2100 according to estimations.
It is thus crucial to find new ways to produce these materials without emitting too much CO2.
In this plot, have a look at the trends regarding materials productions since 1990 [10].
Transportation

Finally, with around 18% of the total emissions, the transportation sector comes last.
Usually, people tend to overestimate the emissions linked to this sector.
The good news is that most terrestrial vehicles can be electrified. Combined with low carbon energy sources, we can decarbonate most of those emissions.
However, reducing the impact of bigger means of transport such as planes, or shipping will be difficult. Indeed, batteries used for electric vehicles are too heavy to be used for aviation or shipping. The future of aviation will require innovations that are currently, either still in development (hydrogen for example) or too expensive (sustainable fuels) compared to fossil fuels [14].
For this last part, we invite you to place each icon (representing a means of transportation) into its corresponding box (total emissions). The pipe corresponds to pipelines emissions [15]. When you are ready, click on the button to see if you are correct.
References
[1] https://climate.nasa.gov/evidence/
[2] https://en.wikipedia.org/wiki/Greenhouse_effect
[3] https://en.wikipedia.org/wiki/Global_warming_potential
[4] https://www.climatewatchdata.org/data-explorer
[5] https://www.breakthroughenergy.org/go-deeper/sectoral-analysis
[6] https://ourworldindata.org/cheap-renewables-growth#
[7] https://www.iaea.org/nuclear-power-and-the-clean-energy-transition/what-is-the-clean-energy-transition-and-how-does-nuclear-power-fit-in
[8] https://github.com/owid/energy-data
[9] https://www.iea.org/articles/the-challenge-of-reaching-zero-emissions-in-heavy-industry
[10] https://ourworldindata.org/food-choice-vs-eating-local
[11] http://www.fao.org/resources/infographics/infographics-details/en/c/218650/
[12] https://www.usda.gov/foodwaste/faqs#
[13] https://ourworldindata.org/food-choice-vs-eating-local
[14] https://centreforaviation.com/analysis/reports/europe-leads-world-aviation-towards-net-zero-carbon-emissions-553358
[15] https://www.iea.org/data-and-statistics/charts/transport-sector-co2-emissions-by-mode-in-the-sustainable-development-scenario-2000-2030


