Russian invasion
of Ukraine


The Russian ๐Ÿ‡ท๐Ÿ‡บ invasion of Ukraine ๐Ÿ‡บ๐Ÿ‡ฆ started on 24.02.2022 . Time hasn't stopped


and neither has aggression๐Ÿคฌ.
We want to show you a few important facts.

Casualties

๐Ÿ“… Every day:

  • X innocent civilians die, including children
  • Y civilians get hurt, including children.

๐Ÿซต In total:
  • X innocent civilians died, including children
  • Y civilians got hurt, including children.
The loos affects their families ๐Ÿ‘ช friends, children and grandchildren's ๐Ÿ‘ถ.


On the right :
total number of killed civilians

civilian

= 100 civilians

Casualties change in time


Analysis and vizualisation of the economic impact of the war

We believe, this war has and will have terrible consequences for the worldโ€™s economy. Our goal is to suggest those consequences by visualizing three economic indicators, that we believed to be important for the worldโ€™s economy and that we believed to be connected to the ongoing war between Ukraine and Russia. We chose to visualize the Europe Brent Spot Price FOB (in US-Dollars per Barrel), the Henry Hub Natural Gas Spot Price (in US dollars per million British thermal unit, a unit that measures the energy and therefore the volume of natural gas), and the exchange rate in US dollars of the main currencies of the world.

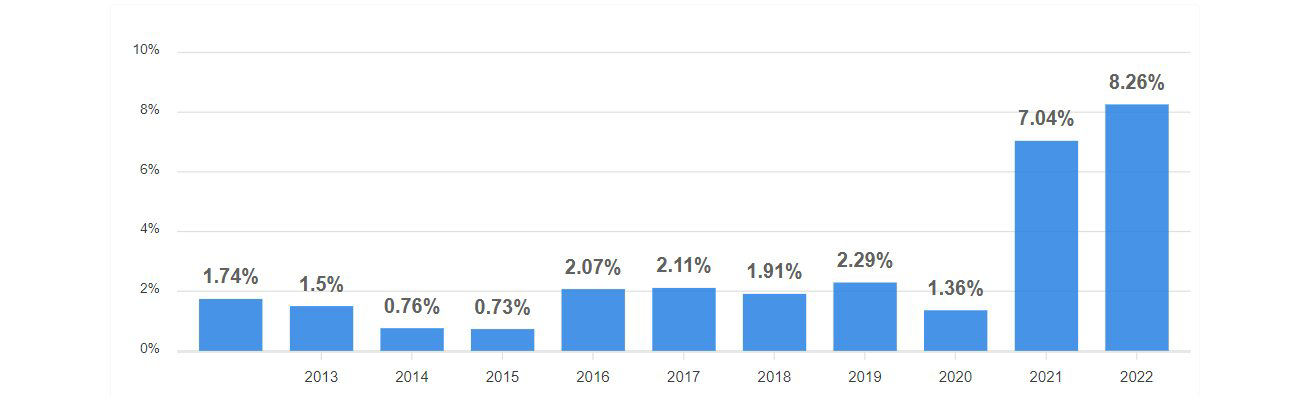
The graph below shows the annual inflation rates in the US for the previous 10 calendar years, from 2012. This shows that the US dollar is loosing value and this is important to keep in mind, considering the data visualization of the next slide. The average inflation rate per month in the last 5 months was of 0.92%.

USA yearly inflation rate

Yearly inflation rate of the US-dollar
1/4

Evolution of some main currencies in the world

2/4

Currency analysis and variation of the brent oil spot price

Considering the visualization of the choropleth map on the previous slide, one easily sees, that the value of the European currencies decreases significantly with time. Since Europe is directly touched by the war, it is no wonder, that the war has such a big economic impact on Europe. In addition to that, it seems that currencies lose value in the world. The inflation of the dollar implies that only the currencies whose exchange rate grows a bit are stable in value, which is not the case for most currencies.

On the right, we see clearly how huge is the increase in the Brent oil spot price in Europe just at the beginning of the war. It then became more stable, but the spot price of the Brent oil remains very high compared to the beginning of the year. This will have devastating consequences for the economy of Europe and of the world, because brent oil and more generally oil is a basic resource used by the majority of the companies in Europe and the world.

3/4

Importance of the gas in russian economy with respect to Europe

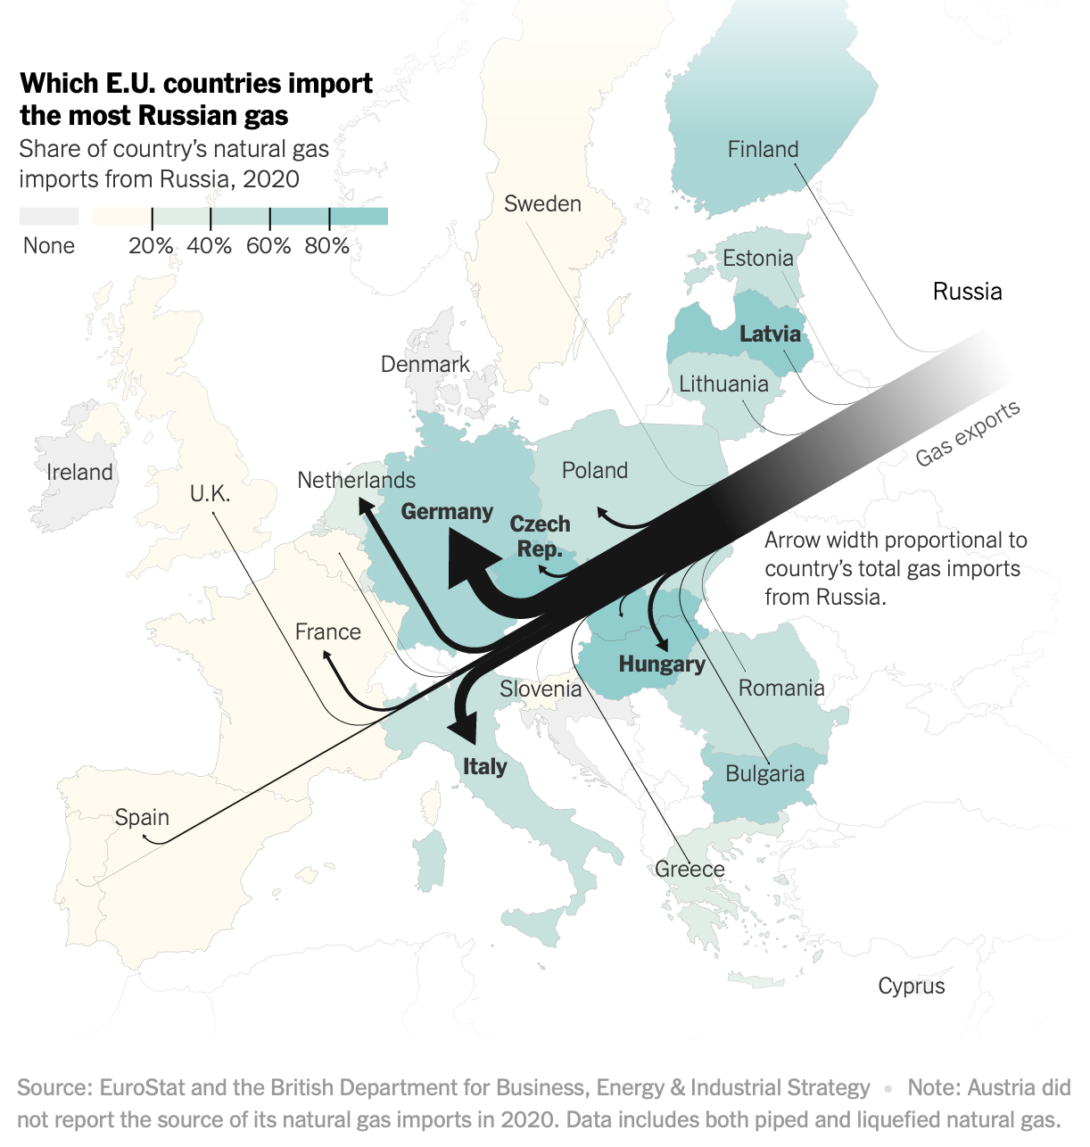
The image on the right represents well the enormous importance of Russian natural gas to Europe. That is why the war necessarily had an impact on the price of natural gas in Europe, but also simply in the world. Indeed, Russia is one of the biggest exporters of natural gas in the world.
In the line chart below, you can see the spot price of the natural gas from Henri Hub given in US-Dollar/Btu. The increase in the demand from Europe probably caused the increase in the price of American natural gas.

Russian gas exportation
4/4

Wordwide reactions

In order to understand the conflict in Ukraine, it is also very important to get an overview of the situation abroad. Indeed, Ukraine is defended by its population, but influential factors come in a wide range of flavors and from a larger area than Ukraine only.

The following page details 4 different pieces of information covering the following aspects of Ukraine's invasion and international impact:

Refugees

Sanctions

Tweet Emotions

Tweet Sentiment

Each one of these themes relate to an aspect of the war as perceived or enforced by non-Ukrainian individuals and entities. We detail them below:
  • Refugees
    The military attacks, bombings, and blocks on the invaded part of Ukraine forced a a large number of civilians to flee their place of living ๐Ÿƒโ€โ™‚๏ธ๐Ÿƒโ€โ™€๏ธ. As a consequence, the neighboring countries, namely Moldova, Romania, Slovakia, Hungary, Poland, Russia, and Belarus have welcomed millions of distressed people, having left everything behind to get to safety. The refugees' data was fetched from the United Nations High Commissioner for Refugees website dedicated to the tracking and information of the refugee crisis.
  • Sanctions
    A large wave of economic, social, and geopolitical sanctions ๐Ÿ”’ was taken from multiple countries against Russia for starting this war. We focus on some of the most important with the visualization of sanctions issued by Australia, Canada, the EU, France, Switzerland, the UK, and the US. The data is gracefully provided by the international sanctions tracking firm Castellum ๐Ÿ”Ž. Castellum tracks different types of issued international filings and has a scope that is larger than the invasion only.
  • Tweets Emotions and Tweets Sentiment
    An important consequence of the invasion of Ukraine is the individuals' reactions across the world. A very good indicator of it is social networks, especially Twitter ๐Ÿ•Š. Using a dataset of 35.58M tweets selected as linked to the war in Ukraine, we run Machine Learning models ๐Ÿง  on the extracted texts and compute the sentiment and emotion of a random subsample of the dataset. The sentiment is computed using a natural language processing model. It indicates whether the tweet demonstrates a positive, neutral, or negative sentiment. The emotion is one of anger ๐Ÿ˜ก, disgust ๐Ÿคฎ, fear ๐Ÿ˜จ, joy ๐Ÿ˜Š, neutral ๐Ÿ˜, sadness ๐Ÿ˜ญ or surprise ๐Ÿ˜ฎ. It is detected in each tweet using another NLP model.

On the left, we can observe a bar plot of the evolution of the total count of refugees fleeing Ukraine. The count starts on the 24th of February and is monitored by the United Nations High Commissioner for Refugees. As described on their website, they collect the data directly from the neighboring countries ministry websites, on a daily basis. As a reminder, the neighboring countries are the following:

On the right, you can find a stacked bar chart of the different sanctions taken by the international community against Russia, the invading force. You can discover the details day by day by hovering above the different columns. This sanctions dataset was put together by an independent international watchlist company, Castellum. Sanctions include restrictions on the movement, usage, intervention of individuals, entities and goods.

Twitter is a very powerful source of data to capture the thoughts of a wide range of people across the globe. The analyzed data is composed of over 35 million tweets.
You can progressively explore the majority sentiment and emotion of the world's population regarding the conflict in Ukraine by navigating through the days. Understandably enough, we can observe a lack of positive sentiment...