Loading...


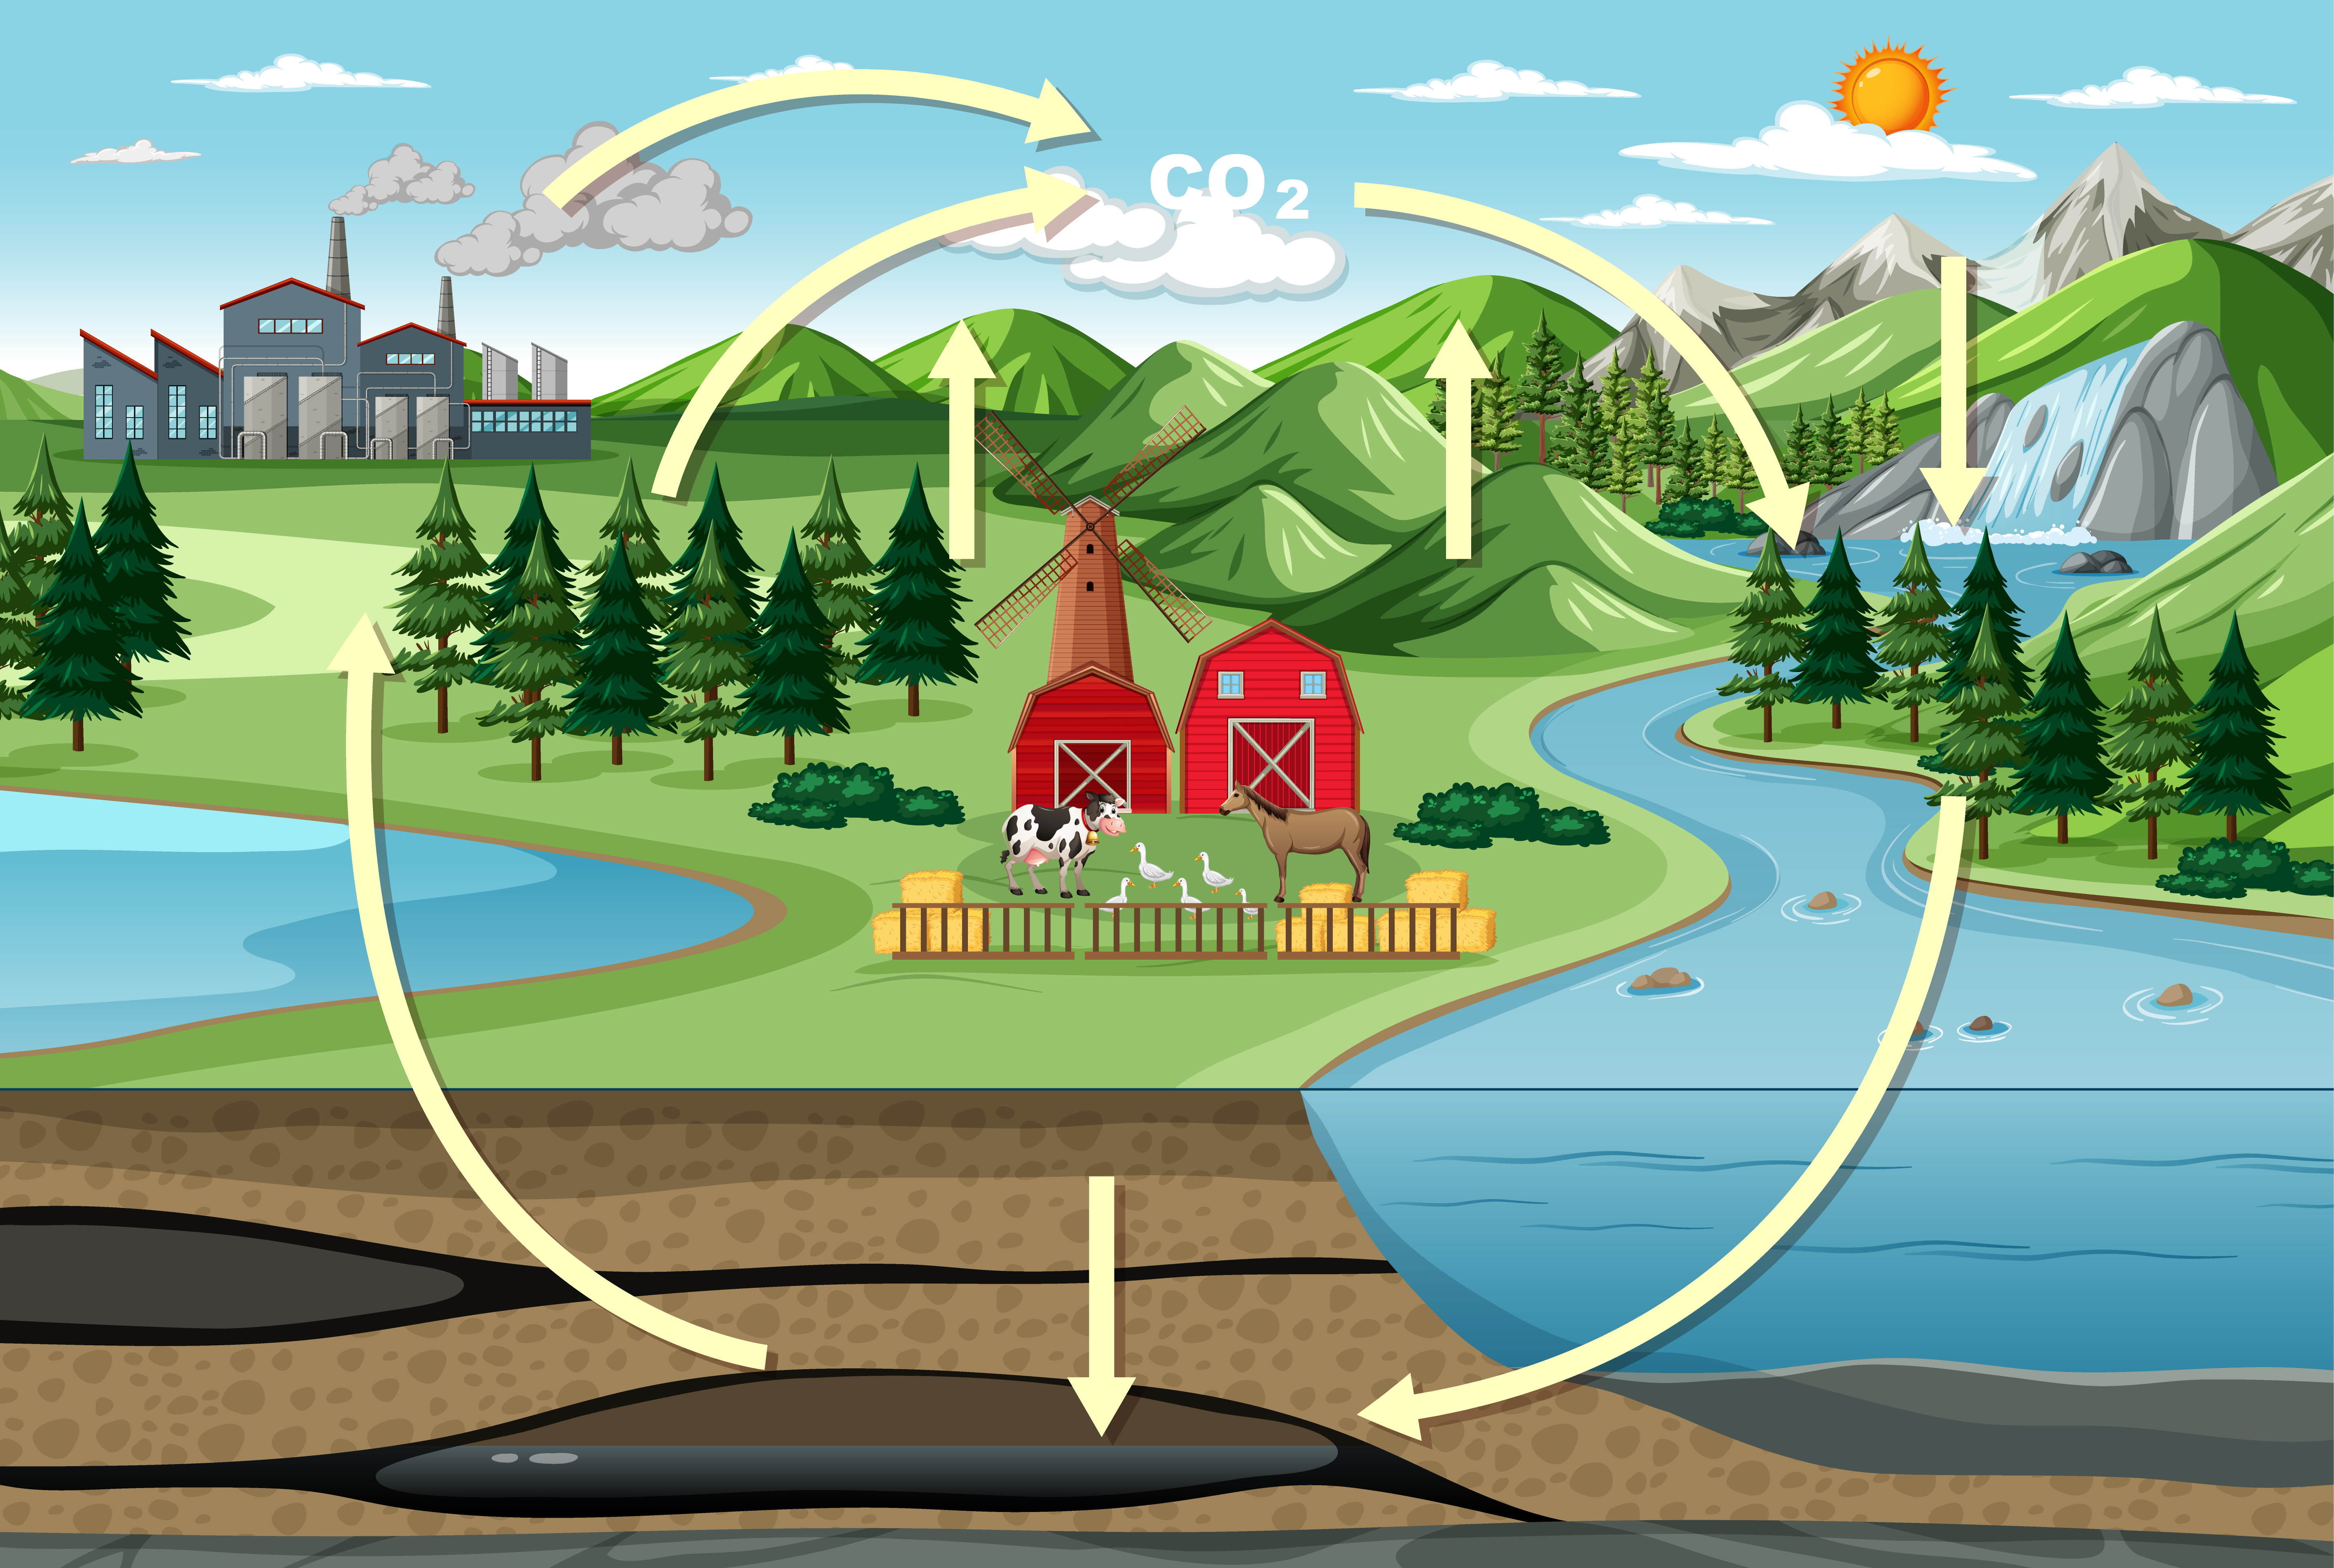
For many years, our earth has provided us with clean air to breathe, water to drink and fertile ground to grow our food on. It is a master in finding balance in countless systems such as the carbon cycle between the atmosphere, land, and oceans or the water balance between evaporation, condensation, and precipitation.
The industrial revolution in the 18th to 19th century marks a period of rapid socioeconomic transformation. While it led to great advancements in technology, the increased release of greenhouse gases into the atmosphere disrupted the earths balance. An intensification of the greenhouse effect happened, where more heat is trapped than released. Global temperatures have since then risen significantly, leading to floods, storms, and wildfires.
In the last 15 years many developing countries have experienced economic growth. This leads to the question what environmental impact the powering of further economic and social development will have.
Join us on a journey to discover the intricate relationship between climate change and country's development.
Before we dive into this question, let's first look on how the temperature has increased over the years and with respect to CO2 emissions. In the graph you can see the upper and lower bounds of the 95% confidence intervals, as well as the mean of the global average land-sea temperature relative to the 1961-1990 average temperature.

You can toggle CO₂ emissions on and off using the checkbox and zoom in the graph using the slider.
The global trend is clearly visible, on both hemispheres. One can see that CO2 has a significant effect on temperature change. But why exactly is CO2 so important with respect to climate change?
CO2 is one of the main drivers of the greenhouse gas effect. This describes the phenomena of trapping some of the heat energy from the sun.
When sunlight reaches the earth, some gets absorbed by the Earth's surface and transforms to heat. It is then emitted back into the atmosphere. Greenhouse gases, absorb and re-emit some of this thermal radiation. While this is a natural and life sustaining process, human activities have significantly increased the concentration of greenhouse gases in the atmosphere leading to anthropogenic (human-caused) global warming.
CO2 is categorized as the primary driver of climate change because of its long lifetime and strong radiative forcing (magnitude of their warming effect).
You can click on a process-box to find out more information about it.
The United Nations (UN) have created the global indicator framework for Sustainable Development Goals (UNSDG) and targets of the 2030 Agenda for Sustainable Development. They monitor more than 200 indicators that are separated into multiple goals. Each country can obtain a grade per index, per goal and all together. Here, we used the data available of 25 indexes from a collection of UN datasets.
You can click on the goals to see the indexes used in this investigation that monitor them.

When comparing different features, it is always important to have a look at their correlations. Correlation matrices give an overview of the interrelationships and is especially useful in detecting dependencies between multiple variables. Lastly, it is important to note that correlation does not mean causation.
Based on an analysis of data availability and quality, seven factors where chosen to represent the UNSDG goals.
You can click on a box to get the corresponding correlation value.
The reality of each country is unique. Let's take a closer look to discover how they behave individually over the years. In particular, how do development indexes compare to CO₂ emissions of the various countries? The next visualization shows normalized features compared against normalized CO₂ emissions for each country individually. Click on a country to load its corresponding data.
You can (shift) double-click on the map to zoom in and out. Hover on a dot on the graph to highlight its index.
Can you find trends in some features inside a country? Even if some countries clearly show correlations, others do not. Let's take a step back and observe the evolution of these values from a global perspective.
The following world maps give you the opportunity to compare countries more easily, while also observing changes through the years. Select an index to compare to CO₂ emissions and start the animation with the play button to observe the values evolve through time.
You can (shift) double-click a map to zoom in and out. You can also use the slider to manually set the year.
Annual CO₂ emissions
No Data

No Data

Year 2002
As we saw before, anthropogenic CO2 emissions are drivers of climate change. However, not all countries are equal in terms of CO2 budget. Indeed, a European person tends to emit much more than an African person for instance. This is due to differences in lifestyle. These differences are also driven by social inequalities.
Thus, in this next graph we will look at the similarities in the distribution of certain indexes and the CO2 emissions. Then, to get a more precise idea of the phenomena, we look at the differences in countries.
You can hover on the bars to get the countries that have the top and last 5 SpearmanR coefficient.
A Coefficient of 1 means that the distribution is equal, -1 means that they are opposite.
Expected results:
More interestingly:
The websites goal is to enable you to explore the very complex and intricate data-set. One can see a clear link between
how wealthy a country is and its CO2 emissions. One can also see that the growth has a less significant influence on CO2
emission. This reinforces the fact that rich countries tend to drive climate change more than emergent ones. This is a
big problem, since it is the less developed countries who suffer the most from climate change impacts.
We hope that you had fun exploring the data-set and that were able to discover something new.
Thank you for tagging along this journey with us. Climate change is a very intricate matter and hence difficult to present in a concise manner. Nevertheless, we hope you discovered something new and had fun while doing it!